How to reverse engineer an Electron app with Reconstruction Labs
Trace Electron preload and IPC with Reconstruction Labs. Download the fixture, run static analysis and check the Export CSV evidence in this tested guide.
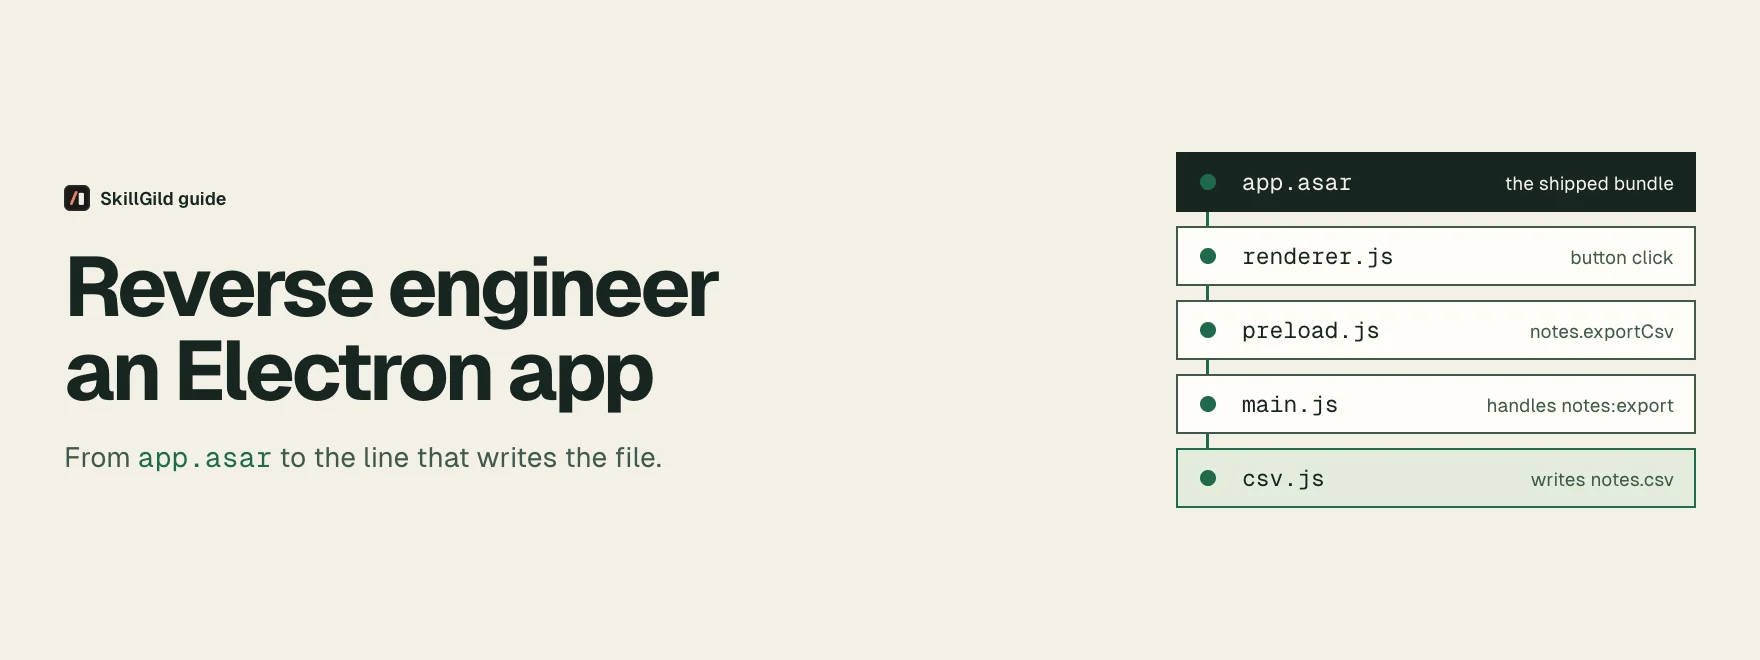
Short answer: to reverse engineer an Electron app, point a static analyzer at its app.asar (or the extracted folder), then follow one feature from the renderer through the preload bridge and IPC channel to the main-process handler. With Reconstruction Labs in Claude Code, static analyze_javascript_application can map those relationships and retain their evidence without running the app. Dynamic expressions may remain unresolved.
We tested this on 14 October 2026 against a small sample Electron app: a notes app with an Export CSV button. The question was the one you'd ask about any app you admire: what actually happens when I click that button? Our test used macOS arm64, Node.js 24.18.0 and npm 11.16.0. SkillGild publishes Reconstruction Labs; this is a teaching fixture, rather than a benchmark of a commercial or obfuscated application.
Download the notes Electron fixture ZIP and extract it. You do not need to install Electron or launch the fixture for this static test. The recorded analysis summary includes our observed counts and evidence identifier.
Try it on a real task: Reconstruction Labs is included with SkillGild Pro.
#What you need
- The app's files. On macOS a packaged Electron app often keeps its code in
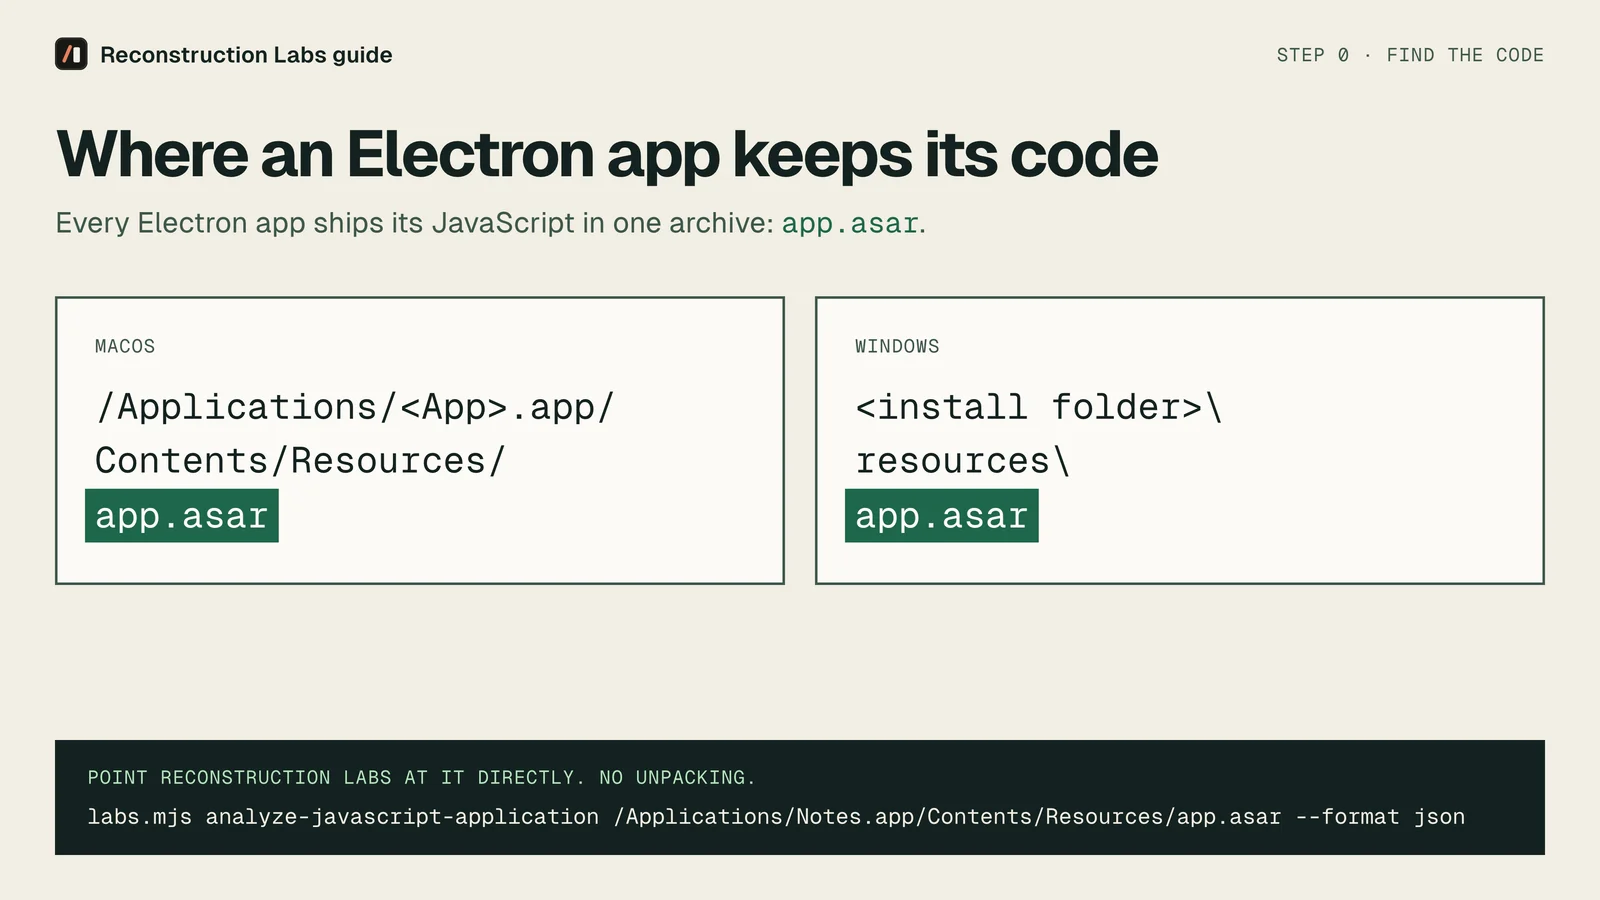
/Applications/<App>.app/Contents/Resources/app.asar. On Windows, look forresources\app.asarinside the install folder. The analyzer accepts an ASAR or an extracted directory. Packaging varies; some files can sit outside the archive. Electron's ASAR documentation explains the format. - Node.js 22.x at 22.19+, 24.x at 24.11+ or 26+, plus npm. Node 23 and 25 are not supported and setup will tell you so. We ran Node 24.18.0.
- Claude Code, or any agent that can run local MCP servers: Codex, Cursor and Gemini CLI all work.
- Nothing else. Static JavaScript and Electron analysis needs no Ghidra, IDA or Hopper. You only need those for native binaries.
#Step 1: Install Reconstruction Labs
skillgild install reconstruction-labs --agent claude-code
node ~/.claude/skills/reconstruction-labs/scripts/setup.mjs
Use the installation directory printed by the CLI; the commands here assume a personal Claude Code install. The first command places the skill, launcher and packed runtime in that directory. The second installs runtime 6.4.0 inside the skill folder and nowhere else. It doesn't touch your global npm packages and it doesn't install analysis engines for you.
What goes wrong: setup refuses with "needs Node.js 22.x at 22.19+, 24.x at 24.11+ or 26+". Switch Node versions (nvm use 24 or similar) and run it again.
#Step 2: Connect it to Claude Code
claude mcp add reconstruction-labs -- node ~/.claude/skills/reconstruction-labs/scripts/labs.mjs mcpRestart Claude Code. Your agent now has 172 Reconstruction Labs tools, from analyze_javascript_application and trace_application_feature to Ghidra-backed procedure_pseudo_code for native code.
You can skip MCP entirely. The runtime also exposes CLI workflows, which is handy in scripts and CI:
node ~/.claude/skills/reconstruction-labs/scripts/labs.mjs analyze-javascript-application /absolute/path/to/notes-electron --json > electron-analysis.json#Step 3: Ask about one feature, not the whole app
A focused question is easier to verify than a request to explain the whole app. Name a behavior you can see:
Use Reconstruction Labs on /absolute/path/to/notes-electron. Trace what happens when I click Export CSV, from the button to the file on disk. Cite the evidence for each step and list what you couldn't confirm.
Claude calls analyze_javascript_application on the target. For a large app the skill tells the agent to request a summary first, then page through the retained result with inspect_analysis_view rather than pulling the whole graph into context.
#Step 4: Read the evidence
Here's the summary our sample produced, trimmed to the parts that matter:
| Finding | Count |
|---|---|
| Browser windows | 1 |
| Preload entrypoints | 1 |
contextBridge APIs |
1 |
| Exposed API members | 1 (notes.exportCsv) |
| Literal IPC channels | 1 (notes:export) |
| Main-process handlers | 1 |
| Paired renderer transmissions | 1 |
| Dynamic channel operations | 0 |
| Sender validation observations | 0 |
| JavaScript files parsed | 4, with 0 parse failures |
| Findings | 21 |
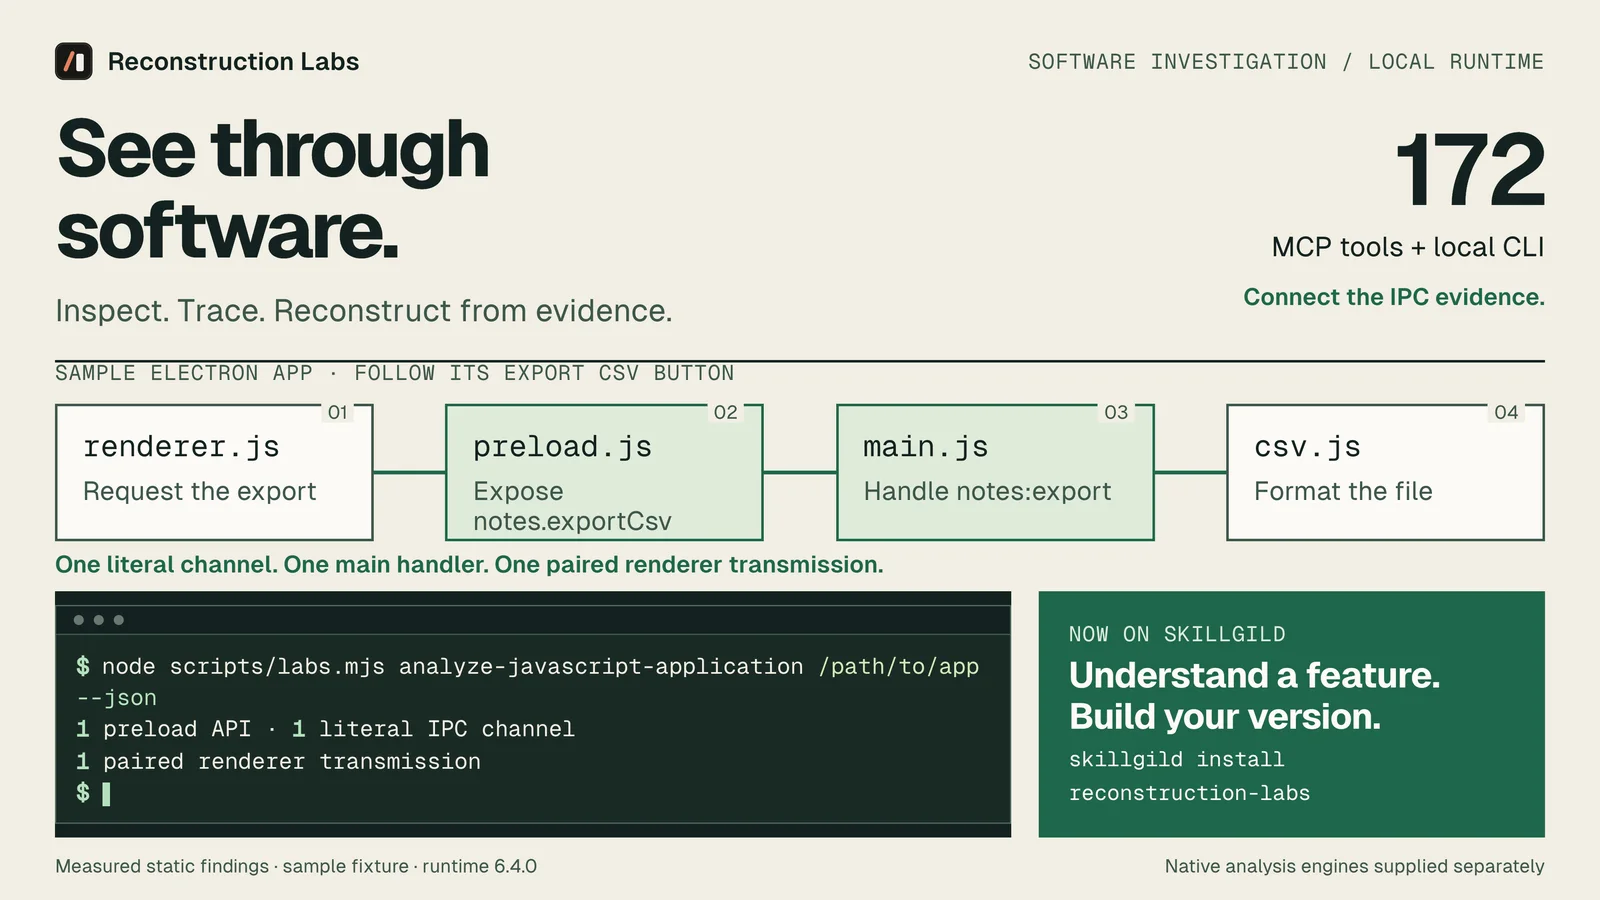
Put in plain language, the trace runs:
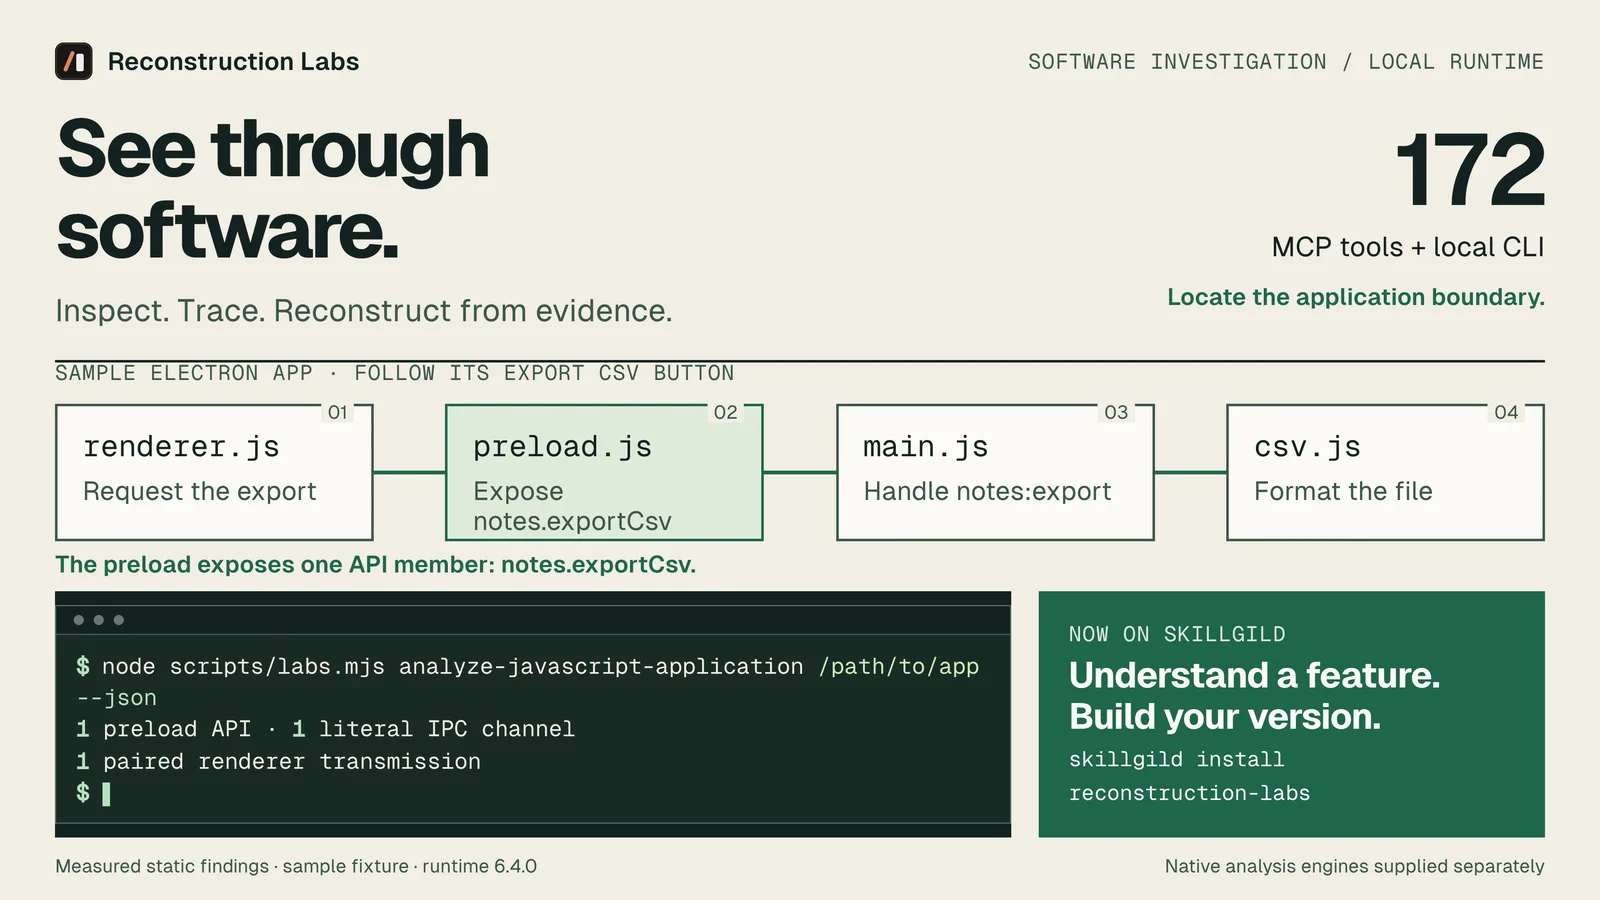
renderer.jscallswindow.notes.exportCsv()when the button is clicked.preload.jsexposes that one function throughcontextBridge.exposeInMainWorld("notes", …), and it does exactly one thing:ipcRenderer.invoke("notes:export").main.jshandlesnotes:exportwithipcMain.handle, builds a path in the user's Downloads folder and writesnotes.csv.csv.jssuppliestoCsv, which formats the rows.
Inspect the graph alongside the source files and the artifact digest. Electron's IPC guide documents the invoke/handle pattern used by this fixture. The paired-channel result supports that specific connection; it does not prove every possible runtime path.
The zero sender-validation count is a reason to inspect the handler. This fixture's handler contains no sender check. On a larger target, a zero count alone would not prove validation is absent: checks can fall outside the analyzer's supported patterns.
We separately executed toCsv with [{ id: 1, title: 'Hello, "Reconstruction Labs"' }]. It returned:
id,title
1,"Hello, ""Reconstruction Labs"""
That checks quotation handling for this input. It does not verify the full Electron click flow. Keep the formatter test separate from the static application trace.
If your counts differ, check that you selected the extracted fixture folder rather than its parent or the ZIP. File changes and runtime versions can change the result. Evidence identifiers can depend on input context; compare the relevant findings rather than expecting every identifier to match.
#Step 5: Respect what static analysis can't tell you
Reconstruction Labs is blunt about its limits, and it hands them to your agent with every result. From this run:
JavaScript and HTML were parsed as inert text; bundle bootstrap code was never executed.
Static imports, entrypoints, workers, endpoints, and storage relationships do not prove runtime execution.
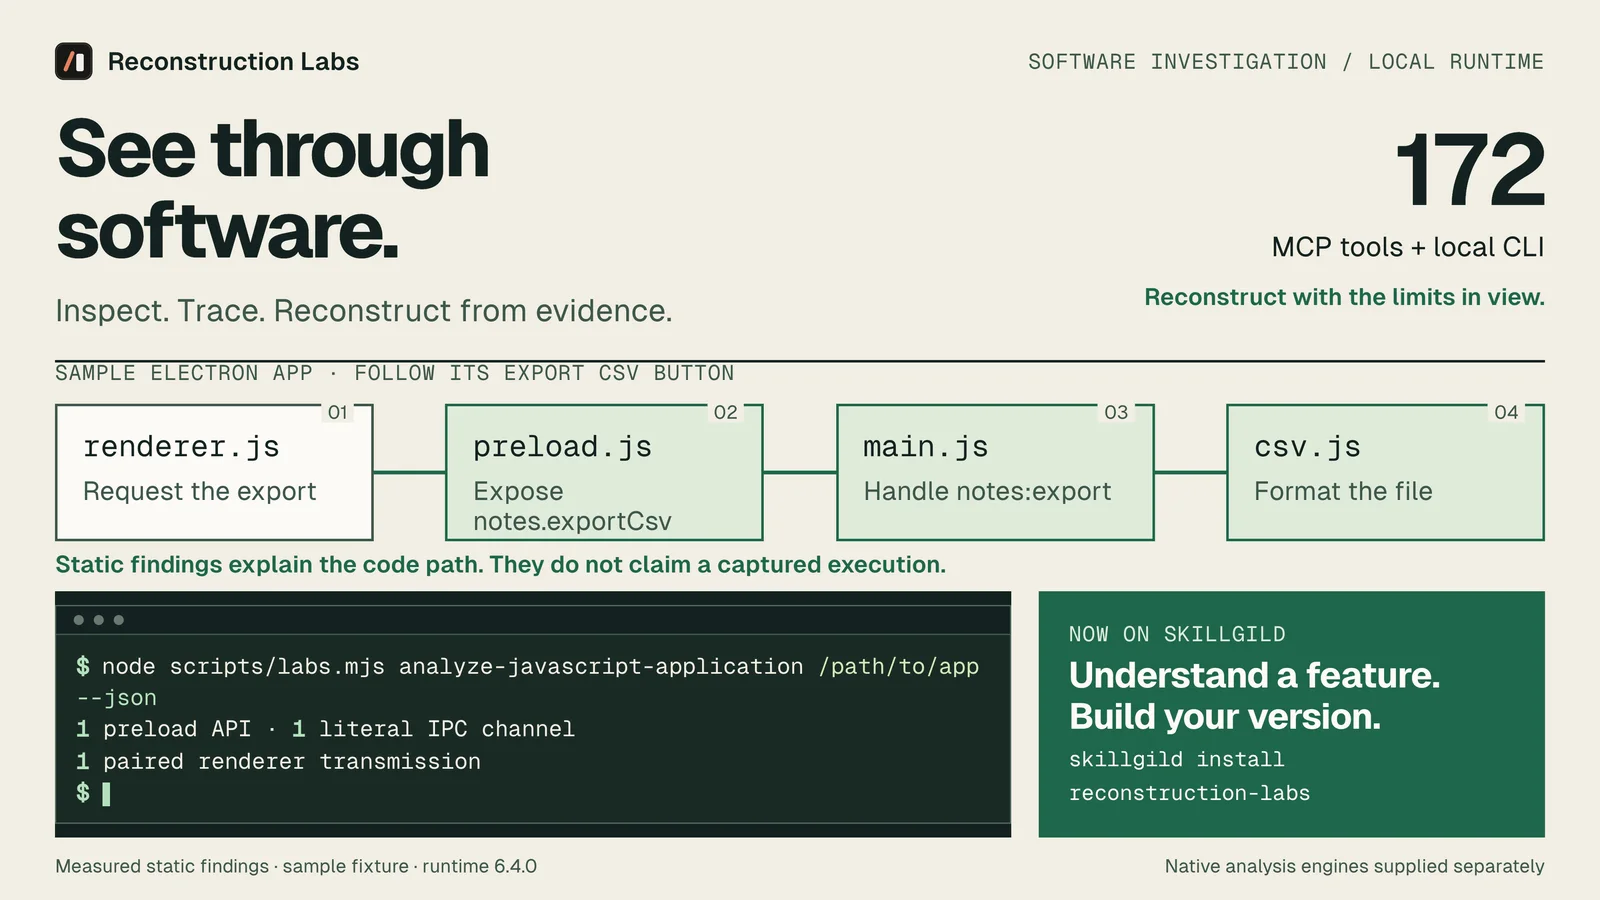
So the trace above is a code path, not a recording of a click. If you need proof the path runs, Reconstruction Labs has runtime tools for that: list_electron_targets to attach to an app you already have open, and capture_electron_scenario to drive one. The skill instructs the agent to keep observations, inferences and unknowns in separate buckets, which is the difference between a reverse-engineering report you can act on and a confident guess.
#Step 6: Build your version
Once the trace is in front of it, ask the agent for what you came for:
Using that trace, implement the same export flow in my Electron app, but validate the IPC sender and let the user choose the save location.
The agent now works from evidence instead of assumptions about how Electron apps "usually" do it. That's the whole point of reconstructing from evidence: you build your own version of a feature with the original's design decisions, and its mistakes, in plain view.
Try it on your own app: Reconstruction Labs is included with SkillGild Pro. Install it with skillgild install reconstruction-labs and ask your agent about the first feature you've wondered about.
#Can I just unzip the ASAR and read the code?
Yes: npx @electron/asar extract app.asar out/ gives you the files. For a four-file app, reading them yourself is quicker. For a real app with a minified bundle, hundreds of modules and IPC channels built from string concatenation, you want something that resolves the preload bridge, pairs each renderer invoke with its main handler and flags the dynamic channels it couldn't resolve. Doing that by hand is where afternoons go.
#Beyond Electron
The same skill covers native binaries (through Ghidra, IDA or Hopper), .NET assemblies, Android APKs, WebAssembly, firmware images, websites and saved HAR captures. See the best reverse-engineering skills and MCP servers for Claude Code for how it compares with single-engine options like GhidraMCP, or Reconstruction Labs vs Reverse Engineer Anything for the SkillGild package and direct public installation tradeoffs. New to how skills and MCP servers fit together? Start with agent skills vs MCP.
Frequently asked questions
How do I reverse engineer an Electron app?
Inspect its JavaScript files or ASAR archive, then follow one feature through the renderer, preload bridge and main-process handler. Reconstruction Labs can analyze these relationships without launching the app. Static findings do not prove runtime execution.
Do I need Ghidra to analyze an Electron app?
The static JavaScript workflow in this guide needs supported Node.js and npm, without a native engine. If a feature crosses into a native component, that component needs an appropriate analysis provider.
Can I reproduce the Electron analysis?
Yes. Download and extract the linked notes-electron fixture ZIP, run analyze-javascript-application on that folder and compare the observed counts with the linked analysis summary. Our runtime 6.4.0 test parsed four JavaScript files and paired one literal IPC channel with its handler.